
Not All Traffic Is Good Traffic: Why Hidden Risks in High-Performing Pages Deserve a Closer Look
Corrosive content isn’t just underperforming—it’s actively working against your goals.
Corrosive content refers to high-traffic pages that fail to convert and distort performance metrics, making it harder to spot what’s truly working. Here’s how to spot it faster, fix it smarter, and build a stronger content portfolio with quadrant-based analysis.
Key takeaways:
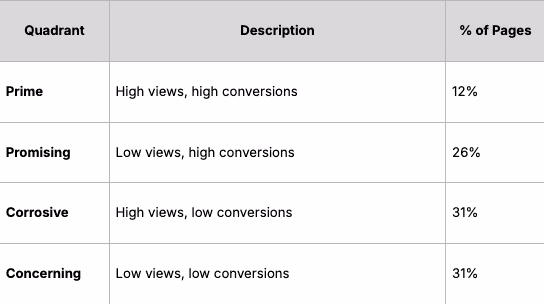
- High traffic doesn’t equal high value—in fact, 31% of all content analyzed fell into the corrosive quadrant: high views, low conversions.
- B2C brands are more vulnerable to corrosive content than B2B brands.
- With normalized View Scores and Conversion Scores, teams can quickly identify what to scale, where to optimize, and what to overhaul.
The Problem with High-Traffic, Low-Conversion Content
Most content audits start with a familiar script: find what’s not working, then decide whether to rewrite, redirect, or remove. But when content draws a lot of attention—and fails to convert—that’s not just a missed opportunity. It’s a risk.
At Knotch, we call this corrosive content: pages that earn high visibility but deliver poor outcomes. Left unchecked, they quietly erode trust—and performance.
The Quadrant Framework
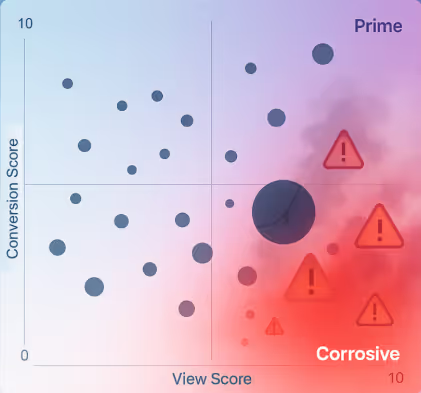
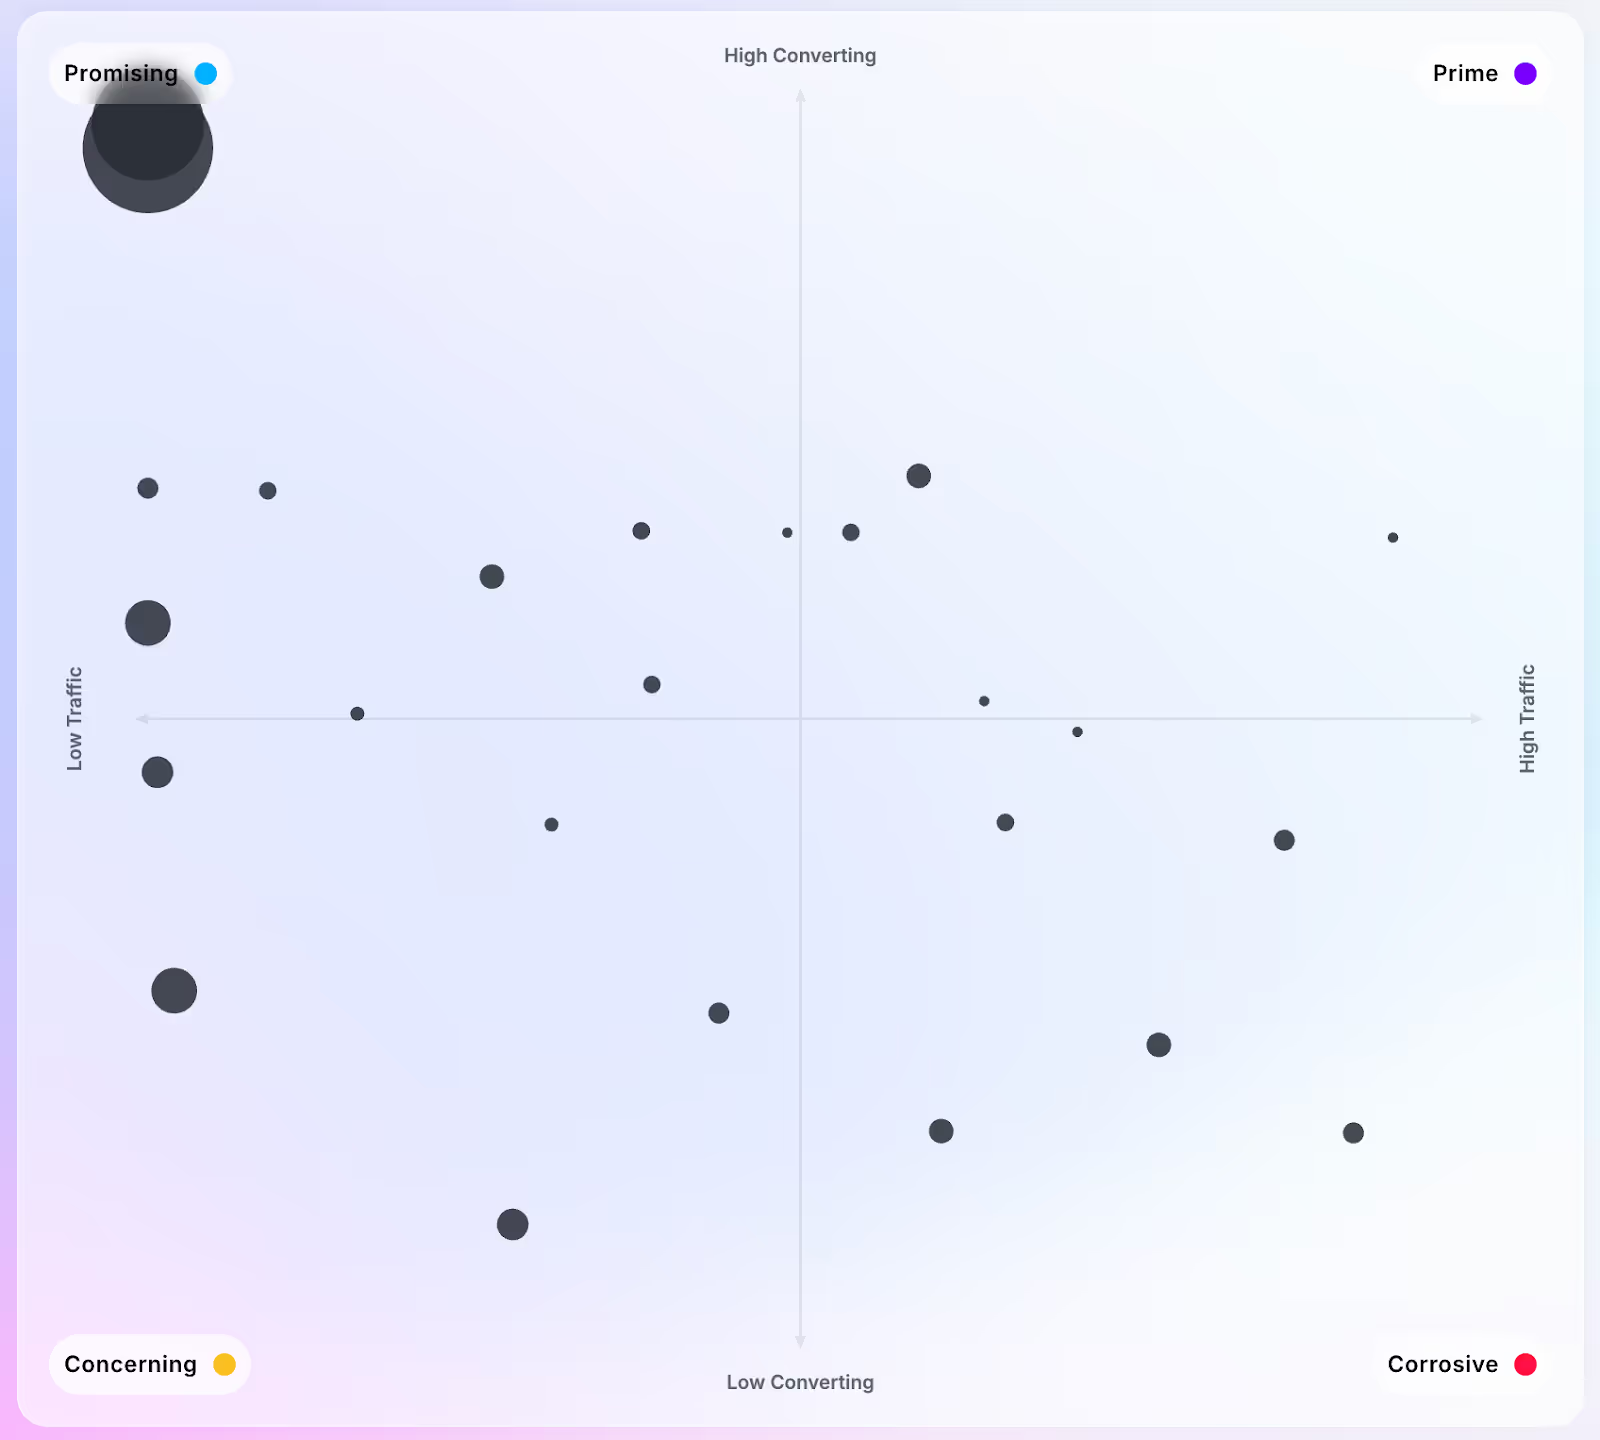
Instead of reacting to surface-level stats, we use quadrants—a visual, data-driven model for understanding how and where content impacts outcomes. Here’s how it works:
- The X-axis measures View Score—a normalized indicator of page views.
- The Y-axis tracks Conversion Score—a normalized indicator of conversion rate.
- Pages are plotted across a 0–10 scale on each axis.
- Bubble size reflects how many pages fall into a given range of performance.
This method allows teams to see their entire content portfolio at once—and pinpoint not just what’s failing, but why. The quadrants are built into KnotchOne and are constantly updated.
What the Data Shows
After analyzing more than 70,000 pages across industries, here’s how content performance breaks down:

These insights offer more than a label—they offer a roadmap.
- Prime content sets the standard to learn from.
- Promising content is ready for an audience boost.
- Concerning content should be deprioritized.
- But corrosive content? That’s where the stakes are highest.
Why Corrosive Content Matters
A single corrosive page can see tens of thousands of views—while converting almost no one. These pages can:
- Draw in traffic that doesn’t convert
- Skew your averages
- Mask underperformance
- Damage brand perception
And because they often look “healthy” on the surface (thanks to high view counts), they’re easily overlooked in traditional audits.
Corrosive Content Hits B2C Harder
When we segmented performance by industry, a key pattern stood out: B2B content tends to be more evenly distributed across quadrants, while B2C content has a higher concentration in the corrosive and concerning zones.
The biggest gap shows up in the Promising category—B2B brands have nearly double the percentage of mid-performing content compared to B2C. Meanwhile, B2C brands are more vulnerable to corrosive content, with over one-third of pages attracting high visibility but delivering low conversions.
Turning Insights into Action
With quadrant-based analysis, content decisions become clearer—and faster. Here's how leading brands are putting this framework into action:
Prime Pages
What to do: Use them as blueprints.
How: Mirror structure, CTAs, and layout for lower-performing pages.
Promising Pages
What to do: Amplify them.
How: Add internal links, refresh keywords, or promote via social, email or other channels.
Corrosive Pages
What to do: Investigate, then overhaul.
How: Identify friction points (e.g., vague CTAs), A/B test fixes, and monitor lift.
Concerning Pages
What to do: Assess relevance.
How: Adjust UX, reposition content, or sunset if no longer aligned to goals.
Build quadrant thinking into your regular flow:
- Monthly heatchecks: Schedule a quick snapshot to spot pages sliding toward corrosion.
- Learning loops: Track which fixes move pages up fastest and turn those into repeatable recipes.
From Corrosive to Prime: An Hypothetical Scenario
To show how quadrant-based thinking can guide real improvements, imagine this scenario:
You have a newsletter landing page that pulls 50,000+ views per month but converts at just 0.5%. It falls squarely in the corrosive quadrant: high visibility, low performance.
Here’s how you might approach the fix:
- Identify the barrier: Data shows most visitors drop off at the weak CTA (“Learn more”).
- Strengthen the call to action: Swap in something more benefit-oriented like “Reserve your spot for exclusive tips” and reposition the CTA button above the average scroll drop-off point.
- Test and iterate: Run the new version for a few weeks, compare lift, and roll out the winner.
The result? A cleaner experience, stronger messaging, and a measurable move toward the prime quadrant.
Final Thought
Corrosive content is sneaky. It looks successful, but it works against you. With quadrant analysis, you don’t just flag the risks—you turn them into results. By pairing smart segmentation with consistent optimization, your team can move faster, waste less, and grow more.
Published June 11, 2025
Become a thought leader
Become a thought leader


Trusted by the largest (and now smartest) brands in the world.
“Before Knotch we did not understand what content was driving business results. Now we understand which content moves the needle. Knotch’s cohesive reporting and insights paint a real picture of what’s happening on our website instead of the patchwork quilt that comes from a Google Analytics approach. With Knotch we have been able to re-prioritize ad spend, route better leads to our SDR team, and inform our content development initiatives.”

"The Knotch platform ensures that we deliver high-performing content tailored to young home shoppers, enhancing their experience and driving better business outcomes.”

"Our partnership with Knotch has been highly successful, empowering us to leverage data-driven insights and refine our content strategy.”